6/8/2012
Solar panels can be a serious investment and a serious addition to your home. While talk around the water cooler tells us that these are out of reach for the 99% and wildly unprofitable, dropping costs and government subsidies have been tilting the scales in the other direction. Let's take a look.
Energy Independence and So Can You
One of the main tenets of alternative energy is energy independence. As one of the major reasons governments worldwide are setting up programs to encourage growth in renewables, reliance on self-produced energy is also very attractive for the rest of us without the geopolitical advantage. In the past, fighting through the initial investment of installing solar panels in your home hasn't payed off, but increasing economies of scale and government subsidies have steadily pulled prices down. One additional reason that heavily subsidized solar panels coming out of China are sold at prices below production costs. These controversial practices have been putting American producers in a corner (such as in the case of Solyndra's infamous demise) while causing an explosion of residential installations and a boom in the domestic solar installation industry.
The feasibility of solar electric power, or photovoltaic energy, in residential installations today, thought to be a myth to rival bigfoot and evolution by some, is actually heavily dependent on region. The real truth is that without subsidies solar would be a reasonable investment only in a handful of places. However, with current subsidies it has become a very good investment in many parts of the US. Higher local electricity prices, having the good luck to live in an area with more sunlight, as well as subsidies and production incentives can all contribute to making up the cost quickly. Once you earn back the initial investment, you can just quit your job (not recommended) and enjoy big checks or low bills from your power company every month. Knowing you're cutting your carbon doesn't hurt either.
Solar Panel Degradation
Another half-truth floating around is the idea that panels lose efficiency over time. This is true. It is also true that it degrades by about 0.7% of its original rated efficiency per year on average
[1], which is slow enough that it has little impact on the time it takes to reacquire your investment.
As you can see from the chart, degradation can lengthen your payback period by only a very short time in most circumstances, even over 15 years. If you need further assurance, most panel providers offer warrantees guaranteeing 80% of the original efficiency after 25 years.
 |
Degradation has very little effect on payback periods.
|
Solar Panels and Snow
Snow can put a big dent in your earnings as a solar producer. In many parts of the US, this can be a serious consideration when installing a photovoltaic system. Snow can cause up to a 10% decrease in your yearly production
[5], possibly more depending on your location and your fastidiousness towards your panels. When there is accumulation, it is necessary to get the snow off the solar panels so they can continue pumping sweet energy into the grid or your home. With only one or two inches of snow some decreased production will continue, but even then you are losing money with each minute.
Installed at steeper inclines like 40° (very likely in northern areas as solar panels are generally installed at or near the degree of your latitude), solar panels can sometimes shed the snow themselves by being heated by the sun, creating a layer of slick water under the snow, having a glass surface, and letting gravity do the rest. With little or no sun, which is often the case in these types of regions, clearing your solar panels can become an additional chore like mowing the lawn or cleaning out your gutters, or you can even jump for some costly installations. There are some companies developing self-heating solar panels that can sense if they are covered in snow to get a layer of water under the snow to let it slide off.
Some solutions I've found for removing snow
-Cheap
24' Telescoping Roof Rake - Possible for lower roofs, adds an additional chore to your life.
Deicing Cabling - Runs only about $1/foot of cable, but may require self installation if your solar installer won't do it. Will waste electricity to melt snow, but can be turned on only briefly to melt snow or prevent accumulation during larger storms.
The Venturi System - Uses air currents to blow snow away from panels, may be useful for very specific setups.
-Medium Range
Heating Mats (video below) - For installation underneath the solar panels, run about $50/sq meter. Like deicing cabling will use a bit of electricity.
-Pricey
Built-in automatic sprayer/wiper (video below) - Looks very cool and effective, but the cost and energy use may be strong deterrents. Also, with this many moving parts maintenance is an additional consideration.
-Useless
Throwing nerf footballs at the roof - Seriously, I've seen this on a lot of forums!
Wait it out - You lose up to 10% of your yield!
How Much Juice?
The average American household in 2010 used 958kW of electricity per month
[3]. This means that to go fully solar the average home's solar system needs to provide 31.5kW per day. One major problem with solar as a blanket solution for all of our energy needs is its intermittent nature, but by being able to pump energy into a grid during low-use times and pull electricity from the grid backed by our friends coal and petroleum at other times, this only applies to those off the grid completely.
 |
When choosing a solar system in your home, consider your average monthly electricity use and the sunniness of your locale. Most people opt for 3500w-7000w systems because of cost and the additional hardware needed past 7600w.
|
Most people install systems to ameliorate their electricity bill headaches at the end of each month, but some go all the way to installing enough solar to cover everything they do and more. Of course monthly production is seasonal and this works much better if you're miserly with your usage, but depending on what area you're in this may be possible. In a place like Arizona, it is not too difficult to install enough panels to power your household, but in the Northeast or Northwest you'd have to install up to 11,000 watts to get most families through the year.
Even with the capital to invest in a larger system, one interesting and unfortunate fact about the US is that AC breaker boxes nationwide are rated to deal with only up to about 7600 watts of power. To go above this, your power company has to install additional expensive equipment to handle the higher wattage, so for this article we are going to stick with 3500w and 7000w installations that fit most people's needs.
Selling Power Back to the Grid
The advantage of creating more power than you use is that your local power company will buy the extra power from you. In some states power companies will pay full retail price up to a very large amount of production (more than a residential installation has to think about) and some states pay only the reduced "avoidance cost" price for anything over your own usage. Check your own state's policy
here and see the "Net Metering Explained" section below for more details.
 |
Solar radiation intensities across the world.
|
 |
Most of the US's solar potential is in the southwest, but electricity
prices and subsidies play a big role in determining viability.
|
Looking at the kWh/m2/day values (equivalent to hours of noontime sunlight per day) on NREL's map, you can see that there is quite a large range between the desert southwest and the frozen north, so we'll analyze the two extremes along with cozy middling North Carolina.
Breaking Even: How long until solar pays for itself
Unsubsidized Solar: 50+ year paybacks...REALLY!
I've chosen Arizona, North Carolina, Washington, and New York as points of analysis because they represent average electricity prices in high and medium sunlight areas and extreme low and high electricity prices in low sunlight areas. They also show a wide range of subsidy policies affecting incentives for both initial investments and electricity production.
When people say that renewable energy is a pipe dream and the costs are out of this world, they're mostly talking about solar. Without any help from the government, panels ARE out of the reach of the average person in some places and end up in the arena of wealthy activists and bad investors. High electricity prices, like in NY, and good sunlight exposure, like in Arizona, can help offset costs just enough to keep an investment within reason.
Getting a solar system for your house without subsidies would be an exercise in futility. Paying off solar panels for 20+ years is a serious investment of time and energy, especially when the economy and housing market have been so volatile and unpredictable. In regions like Washington State with low electricity prices and poor sun exposure, it would take so long to reclaim your initial costs that degradation becomes a serious barrier, not to mention it will probably be your grandchildren reaping the rewards of your investment.
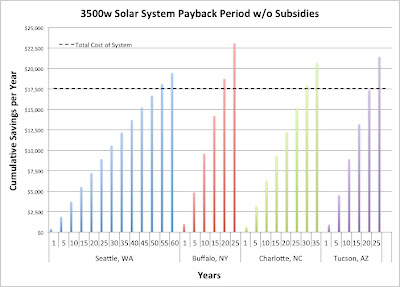 |
Here you can see that without subsidies, residential solar is impossible
in most places. It takes so long in Seattle that you can actually see the
curve cause by loss from solar panel degradation.
|
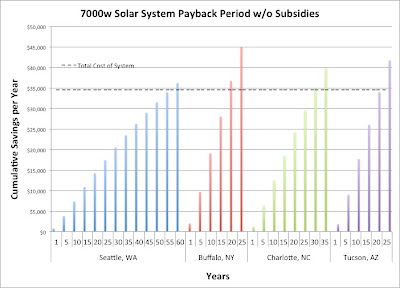 |
Looks very similar to the chart above because payback periods aren't
usually affected by installation size after about 3000 watts because the
per-watt cost hits the industry bottom
|
One item of note is that once you reach systems of about 3000 watts in size, the per watt hardware cost of panels remains fixed at the industry low of about $1.30/watt and per watt installation costs run about $3 per watt, even for much larger residential systems. This means that there is no advantage of buying a larger system as far as payback period is concerned; the differences are the initial cost and the amount you save after your panels pay themselves off. There is also the issue of producing more than your average monthly usage; in some states your reimbursement is at the lower "avoided cost" rate, as opposed to standard retail rates. See the "Net Metering Explained" section below for more details.
The good news for everyone is that there ARE subsidies everywhere nationwide, so nobody has to deal with these rates.
Subsidized Solar: Big Gov' at Work
I've chosen Arizona, North Carolina, Washington, and New York as points of analysis because they represent average electricity prices in high and medium sunlight areas and extreme low and high electricity prices in low sunlight areas. They also show a wide range of subsidy policies affecting incentives for both initial investments and electricity production.
When installing solar in your home, it is important to know what subsidies and incentives apply to you to judge correctly how much the system will cost and how fast it will pay itself off. Incentives can effect both the initial investment (usually in the form of tax breaks or per watt one-time price cuts) and the value of the electricity produced (usually as increased payment per kilowatt for each kilowatt of electricity you feed into the grid).
In 2006 the federal government created a tax incentive for solar worth 30% of the installed cost, "installed cost" referring to the entire system including parts and installation
[4]. Many states have their own incentives that work in conjunction with the federal tax break. Each state is very different, creating a wide range of prices and production incentives. Find information on your state's renewable energy incentives at
dsireusa.org.
Federal Incentives
-Tax credit worth 30% of the total installed cost (this includes all initial hardware and installation costs)
State Incentives
Washington: Low sunlight, low priced electricity
| Seattle, WA | Cost of Installation (3.5kW) | Yearly Savings | Payback Period |
| Without Subsidies | 17550 | 380 | 54 years |
| With Subsidies | 12285 | 1089 | 12 years |
| Chelan County | 12285 | 2129 | 6 years |
-Sales tax exemption
-Additional 15
¢ per kW produced on top of retail electricity price
Special Case: Chelan County
-Additional 22
¢ per kW produced on top of Washington State incentive and retail electricity price up to $5000/year
New York: Low sunlight, high priced electricity
| Buffalo, NY | Cost of Installation (3.5kW) | Yearly Savings | Payback Period |
| Without Subsidies | 17550 | 982 | 19 years |
| With Subsidies | 5276 | 982 | 6 years |
-Sales tax exemption
-$1500 per kilowatt installed up to 7kW or 40% of total installed cost, whichever is lower
-25% of net cost (price after other incentives applied) up to $5000
North Carolina: Average sunlight, average priced electricity
| Charlotte, NC | Cost of Installation (3.5kW) | Yearly Savings | Payback Period |
| Without Subsidies | 17550 | 646 | 30 years |
| With Subsidies | 6142 | 1285 | 5 years |
-Sales tax exemption
-An additional 10
¢ per kW produced on top of retail electricity price for installations smaller than 5kW
-35% of total installed cost up to $10,500
Arizona: High sunlight, average priced electricity
| Tucson, AZ | Cost of Installation (3.5kW) | Yearly Savings | Payback Period |
| Without Subsidies | 17550 | 911 | 21 years |
| With Subsidies | 8660 | 911 | 10 years |
| Cochise County | 4285 | 911 | 5 years |
-Sales tax exemption
-25% of total installed cost up to $1000
-$750 per kilowatt installed up to 30kW (with Tucson Electric Power, but similar deals are commonly offered by local power companies throughout AZ)
Special Case: Cochise County
-$2000 per kilowatt installed up to 30kW or 40% of total installed cost, whichever is lower (with Chelan County PUD, instead of the $750/kW offered by Tucson Electric Power)
The Full Breakdown
I've chosen Arizona, North Carolina, Washington, and New York as points of analysis because they represent average electricity prices in high and medium sunlight areas and extreme low and high electricity prices in low sunlight areas. They also show a wide range of subsidy policies affecting incentives for both initial investments and electricity production.
Subsidies make solar affordable in the US. As you can see from the graphs, they can affect both the initial price of installation (the dotted lines) and the savings each year. Like I mentioned in the previous section, other than the nationwide federal tax credit letting you get back 30% of the total installed cost, each state has very different incentives for a variety of possible reasons.
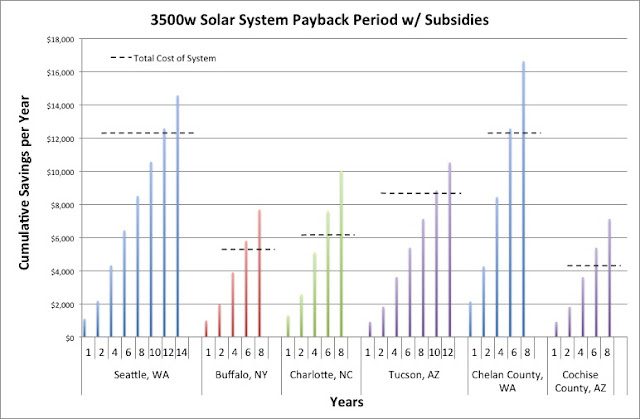 |
Here, I've compared 3500 watt solar installations in 4 regions including 2 examples of unusually high subsidies
in rural areas. With subsidies, the payback period is very reasonable even when taking low sunlight exposure and low electricity prices into consideration. |
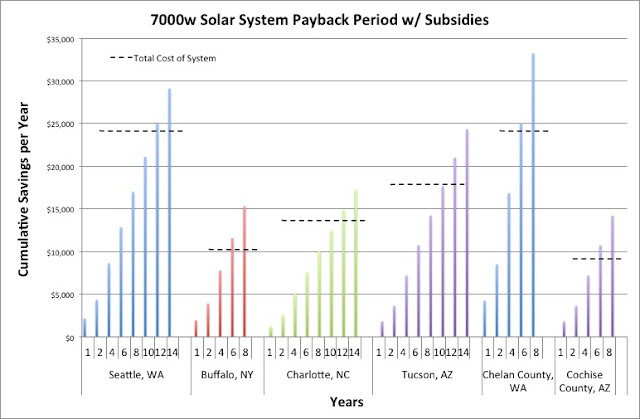 |
Larger installations have almost exactly the same cost per watt, so payback periods will be similar. The
exception is in North Carolina where the 10¢ per watt production incentive only applies to systems smaller than 5kW.
|
Seattle, WA: Low sunlight, low priced electricity
 |
The iconic Seattle skyline on a good day for solar! If only
there were more...
|
Along with having poor sunlight, electricity costs (and therefore the amount you save) in Washington state are some of the lowest in the country at about 8
¢ per kWh, which is why the payback period without subsidies is over 50 years. To encourage solar installations, the state offers solar producers 15
¢ per kWh produced, getting 23
¢ per kWh total to the producer and helping pay off your system in a fraction of the time.
In the extreme case of rural Chelan County well outside of Seattle, the local power company offers an additional incentive for production on top of the already generous state subsidy, bringing the total up to a ludicrous 45
¢ per kilowatt! This is an exception to the rule, but a good example of how some small areas will have surprising benefits for solar. The only subsidy on the initial investment is the federal 30% reduction (definitely nothing to sneeze at).
Buffalo, NY - Low sunlight, high priced electricity
 |
Even with its wintery climate, Buffalo can be a great place
for solar. At least cleaning snow off your roof-mounted
panels will be easy!
|
As a native of nearby Rochester, I can attest to the fact that upstate NY has some of the worst sunlight conditions in the country. The reason I chose to look at this area when Seattle is a perfectly good example of low sunlight exposure is that New York State (like much of the northeast) has some of the highest electricity prices in the country as well at about 19¢ per kWh. High local electricity prices means high savings when you install a solar setup in your home, letting you repay your investment as fast as in Arizona despite the poor light conditions. Add to that New York's generous subsidies and New York State becomes one of the best places to go solar in the country.
Along with the federal subsidy covering 30% of the total installed cost, New York State gives you $1500 for each installed kilowatt up to 7 kW or 40% of the total installed cost. After these are taken out of the total installed cost (this point being known as Net Cost), New York covers 25% of what is left up to $5,000.
Snow can create problems in this part of the world, cutting up to 10% of your yearly production if not dealt with. See the above section "Solar Panels and Snow" for more information and a number of possible solutions.
Charlotte, NC - Average sunlight, average priced electricity
 |
NC State's Solar Center promotes solar installations in
North Carolina's relatively solar-friendly environment.
|
North Carolina jumps in as the most normal of the examples with sunlight levels right in the middle and electricity costs at almost exactly the national average. The subsidies are also adequate, but not extraordinary, making it a good basis for general comparison.
Like Washington and unlike New York, North Carolina has production incentives to encourage solar by increasing your monthly electricity earnings (A.K.A. savings). Doubling the 10¢ per kWh electricity price given by your local power company, the state pays producers with installations smaller than 5kW an additional 10¢ for each kWh produced. This makes it much more worthwhile to install a smaller system because, as you can see in the graphs above, the payback period doubles with systems not covered by the production incentive.
North Carolina also subsidizes the initial cost of your solar electric system, with a generous tax break of 35% in addition to the 30% provided by the federal government, adding up to 65% of the total installed cost being covered by the government.
Tucson, AZ - High sunlight, average priced electricity
 |
Arizona's high levels of sunlight attracts many large solar installations.
The 10MW Black Mountain Solar Project is currently under construction
near Kingman, AZ.
|
Arizona, and especially Tucson, has the best sun in the US and average electricity prices at 11¢ per kWh. As one might expect, this is coupled with limited incentives for residential solar installations from the state. There are no production incentives, likely because solar production in this region is very efficient, and only limited initial cost cutting measures. Unlike the other states mentioned, Arizona's state government subsidies mostly work through power companies by providing them incentives to chip in for your solar panels, making these incentives very region specific. There is also the minimal $1000 subsidy provided by the state.
Tucson is a good example of what can be expected in Arizona, with the local power company paying $750 per kW installed up to 30kW. Compared to New York's $1500 per kW installed up to 7kW (among NY's other subsidies) this is a miserly motivator, but it does encourage much larger home systems. The federal tax credit covering 30% of the total installed cost applies here as well of course.
The nearby Cochise County has a much more generous incentive to reduce installation costs immensely by offering $2000 per kW installed up to 10kW, cutting the payback time nearly in half. Like Chelan County, this is a good example of local regions offering deals that completely change the value of a solar investment.
 |
Note that these are an average of electricity prices for all sectors. For prices divided by residential, commercial, industrial, and transportation sectors for each state through 2010, look at the EIA's State Electricity Profile
|
A Few More Things
A Word About Thin-film Solar and Other New Tech
In a perfect vision of the future of solar, every man-made object on earth would be covered in thin-film solar material and every window coated with transparent solar absorption technology. With only a slight tint to the window (already standard on most office buildings), the entire surface of the building becomes a giant photovoltaic panel. It is an excellent use of already existing surfaces and would prevent us from wasting arable land on solar electric farms. There are even developments going towards spray-on thin-film solar to coat nearly any surface
[6]. Solar technology like this would bring production and material costs down dramatically and make installation easy enough that your local car garage could install solar tints in your car.
This technology is still very far behind in a couple of areas. The efficiency is too low and the materials degrade too fast. Good thing for us, these technologies are making leaps and bounds, such as
GM's new pre-market thin-film solar panel that demonstrated 12.8% efficiency in the field and
New Energy Technologies' SolarWindow.
Hopefully, we'll soon see some big steps towards bringing this technology to a useful point and introducing it to the market in an effective way. A low-cost, efficient, and invisible solution like one of these would push solar that much closer to replacing fossil fuels.
Increasing Future Energy Costs Improves Payback Period
Many groups worldwide, spanning from oil insiders to renewable advocacy groups, such as the Exxon Mobile
[7], the Edison Electric Institute
[8], and the International Energy Institute
[9], are predicting huge increases in energy demand and price. These increases will come steadily as population increases in the developed world, and much faster in developing countries that have to deal with faster population growth as well as adoption of modern technology and more consumption-based lifestyles. Another trend to consider is the decreasing prices of solar panels and installation costs, which came down considerably in just the past two years.
[10]
An investment in solar now may be more difficult in regions like Washington State, but in the 12 years it takes to pay off the investment it seems likely that we may see oil and electricity prices continue to increase. If these likely predictions prove true, an investment in solar is one way to ensure price stability for yourself in a market of quickly increasing demand and a supply that will not be able to keep up.
Net Metering Explained
Although it can be quite complicated when you get up into much larger capacities, for residential installations net metering is actually quite simple with little variation between states. In general, local power companies are required by law to install a meter that measures your power used and power generated (thus "net" electric power metering). The value of the power generated by your renewable energy system (solar, wind, etc) will then be calculated based on retail rates and taken out of your next month's electric bill.
When you are creating more power than you are using, some states will calculate the additional value at the "avoided cost" rate. Although theoretically they should be nearly the same as retail prices
[11], the avoided costs are generally much lower than retail prices
[12][13], sometimes by as much as 50%, this can be a big problem for reclaiming your investment in residential solar and wind. This also encourages people to only produce as much as they use, because any incentive to go past that is severely reduced. This is different state-by-state. For example New York and Arizona calculate excess produced electricity with the avoided cost rates, whereas North Carolina and Washington use the higher retail prices to compensate energy produced that exceeds your household consumption.
[14]
For detailed information on individual state net metering policies, look
here.
Useful Vocabulary
Retail Rates: The price that YOU pay for electricity. This includes the actual fuel and maintenance costs for the power plant as well as taxes.
Avoided Cost: The cost that the power plant avoided because you created additional energy. This includes fuel and maintenance costs that were avoided as well as avoided capacity costs. Avoided capacity is the value to the power company of not building more power plants to meet increasing demand for electricity. In the simplest terms possible, if the demand for power increases by 1000 kw, but people with solar panels are producing 1000 kw of additional energy, the power company doesn't have to spend money building a 1000 kw power plant.
[15]
Resources
A few calculators to figure out the cost of a solar installation in your state based on your needs:
Solar Estimate Calculator
Altestore On-grid Calculator
An off-grid calculator:
Altestore Off-grid Calculator
References
[1]http://solarpanel-direct.com/decrease-solar-panel-efficiency
[2]http://ijuancarlo.wordpress.com/2011/06/03/22/
[3]http://205.254.135.7/tools/faqs/faq.cfm?id=97&t=3
[4]
http://www.dsireusa.org/incentives/incentive.cfm?Incentive_Code=US37F&re=1&ee=1
[5]http://www.snow-and-spray-away.de/side/index.php/english
[6]http://www.newenergytechnologiesinc.com/technology/solarwindow
[7]http://www.exxonmobil.com/Corporate/files/news_pub_eo.pdf
[8]http://205.254.135.7/conference/2008/conf_pdfs/Monday/owens.pdf
[9]http://www.worldwatch.org/node/5936
[10]http://newscenter.lbl.gov/news-releases/2011/09/15/tracking-the-sun-iv/
[11]http://efc.umd.edu/pdf/Canney_AvoidedCostMethodology.pdf
[12]http://robertrapier.wordpress.com/category/avoided-cost/
[13]http://ratecrimes.blogspot.com/2009/05/avoided-cost.html
[14]http://www.dsireusa.org/incentives/index.cfm?EE=1&RE=1&SPV=0&ST=0&searchtype=Net&sh=1
[15]http://energync.org/assets/files/AvoidedCosts.pdf
Solar panel, additional hardware, and installation cost information are estimates and were found at http://www.altestore.com/ and through phone conversations with sales representatives.
State electricity costs are from 2010 and were found at http://205.254.135.7/electricity/state/pdf/sep2010.pdf
State incentive information was found at http://www.dsireusa.org/
-http://www.ncgreenpower.org/resources/index.html#expedited
-http://www.azdor.gov/Portals/0/Brochure/543.pdf
-https://www.tep.com/Renewable/Home/PV/